Gas distribution asset hierarchy template
A worked example of a gas distribution asset hierarchy: 27 classes in 4 levels, 33 data points and 14 decisions, each linked to the lifecycle stage it supports. It's a starting point built on general industry practice, not on any organization's real data.
Opens as your own editable copy. Nothing to sign up for.
- classes
- 27
- levels
- 4
- data points
- 33
- decisions
- 14
- lifecycle stages
- 6
The levels
4 levels, from the whole network down to the part you maintain. Rename them to suit.
| Level | What it holds |
|---|---|
| 1. System | The whole network or portfolio. Holds the data points every asset shares. |
| 2. Asset group | A family of assets that are managed, budgeted and reported together. |
| 3. Asset class | Assets alike enough to share a design life, an inspection regime and a cost model. |
| 4. Component | A part that is inspected, maintained or replaced on its own schedule. |
The full class outline
Every class, with the data points it defines in italics. A class passes its data points to everything beneath it.
- Gas distribution systemEvery pipe, station and device that moves gas from the supply to the customer.the shared data points below
- MainsPipe in the street that carries gas to the services.Material, Nominal diameter, Maximum allowable operating pressure, Length, Leak count (5 years)
- Steel mainCoated or bare steel, usually cathodically protected.Coating type, Cathodically protected
- Cast iron mainLegacy jointed pipe, prone to breaks and joint leaks.Joint type
- Plastic mainPolyethylene and other plastic pipe.Resin / vintage class
- ServicesThe line from the main to a customer's meter.Service material
- Service lineThe buried pipe from the main to the riser.Excess flow valve installed
- Service riserWhere the service rises above ground to the meter.Riser type
- Regulator and metering stationsFacilities that cut pressure between systems and measure gas.Inlet pressure, Outlet set pressure
- Gate stationTakes gas from the transmission supplier into the distribution system.
- OdorizerAdds odorant so leaks can be smelled.Odorant level check
- Custody meterMeasures gas bought from the supplier.
- District regulator stationReduces pressure between parts of the network.
- Regulator runThe regulator and its valves; often two runs for redundancy.
- Overpressure protectionRelief valve or monitor regulator that stops pressure exceeding the limit.Protection type
- Station pipingAbove-ground pipe, fittings and supports inside the station.
- Gate stationTakes gas from the transmission supplier into the distribution system.
- ValvesValves used to isolate parts of the network.Valve type, Last operated date
- Emergency valveA valve named in the emergency plan to isolate a section quickly.
- Mainline valveOther valves on mains.
- Service valveCurb valve on a service line.
- Cathodic protectionEquipment that stops buried steel from corroding.Pipe-to-soil potential
- RectifierSupplies protective current to the pipe.Output current
- Anode bedSacrificial or impressed-current anodes in the ground.
- Test stationWhere pipe-to-soil readings are taken.
- Customer meter setsThe meter and regulator at the customer.Meter capacity, Meter location
- Residential meter setMeter and regulator for a home.
- Commercial and industrial meter setLarger meters, often with their own regulator station.
- MainsPipe in the street that carries gas to the services.Material, Nominal diameter, Maximum allowable operating pressure, Length, Leak count (5 years)
The shared data points
11 data points defined once, on Gas distribution system, and inherited by every class. Each one carries a reason: the decisions it feeds.
| Data point | Type | Feeds decisions |
|---|---|---|
| Install dateStarts the asset's life clock. Age, remaining life and renewal timing are all calculated from it. | date | As-built acceptance, Long-term financial forecast |
| AgeGroups assets by vintage for inspection planning and replacement forecasting. | number · years | Inspection frequency, Long-term financial forecast, Retire or abandon |
| Expected useful lifeThe design or industry life for this class. Sets when renewal should be planned. | number · years | Long-term financial forecast, Capital renewal program |
| Remaining useful lifeHow long the asset can keep serving. The basis for the renewal year and the repair-or-replace call. | number · years | Capital renewal program, Repair, rehabilitate or replace |
| Condition scoreMeasured physical state, 1 (very good) to 5 (very poor). Drives inspection, maintenance and renewal decisions. | number · 1–5 | Inspection frequency, Maintenance strategy, Repair, rehabilitate or replace, Retire or abandon |
| Likelihood of failureHow likely the asset is to fail, from condition, age and failure history. Half of the risk score. | number · 1–5 | Risk ranking |
| Consequence of failureHow much a failure would cost in safety, service, environment and money. The other half of the risk score. | number · 1–5 | Risk ranking, Inspection frequency, Maintenance strategy |
| Risk scoreLikelihood times consequence. Ranks assets so money goes to the highest risk first. | number · LoF × CoF | Risk ranking, Capital renewal program, Repair, rehabilitate or replace, Retire or abandon |
| Replacement costWhat it would cost to replace today. Feeds the capital plan and the long-term forecast. | number · $ | Capital renewal program, Long-term financial forecast, Repair, rehabilitate or replace |
| Planned rehab / replace yearThe year renewal is planned. Turns risk and remaining life into a schedule and a budget. | number · year | Capital renewal program, Long-term financial forecast |
| PM / CM ratioShare of maintenance hours that were planned rather than reactive. Shows whether the maintenance strategy is working. | number · % | Maintenance strategy |
The decisions, and the lifecycle stages they sit in
9 decisions are shared by every template and 5 are specific to this one. The lifecycle runs Plan, Create, Operate, Maintain, Renew and Dispose.
| Decision | Stages | Kind |
|---|---|---|
| Risk ranking | Plan › Needs assessment | Shared |
| Capital renewal program | Plan › Capital planning, Renew › Replace | Shared |
| Long-term financial forecast | Plan › Capital planning | Shared |
| Design standards | Create › Design | Shared |
| As-built acceptance | Create › Construct | Shared |
| Inspection frequency | Operate › Inspect | Shared |
| Maintenance strategy | Maintain › Preventive | Shared |
| Repair, rehabilitate or replace | Maintain › Corrective, Renew › Rehabilitate, Renew › Replace | Shared |
| Retire or abandon | Dispose › Decommission | Shared |
| Leak survey frequency | Operate › Inspect | Industry |
| Pipe replacement priority | Plan › Needs assessment, Renew › Replace | Industry |
| Corrosion remediation | Maintain › Corrective | Industry |
| Pressure monitoring | Operate › Monitor | Industry |
| Meter change-out | Renew › Replace | Industry |
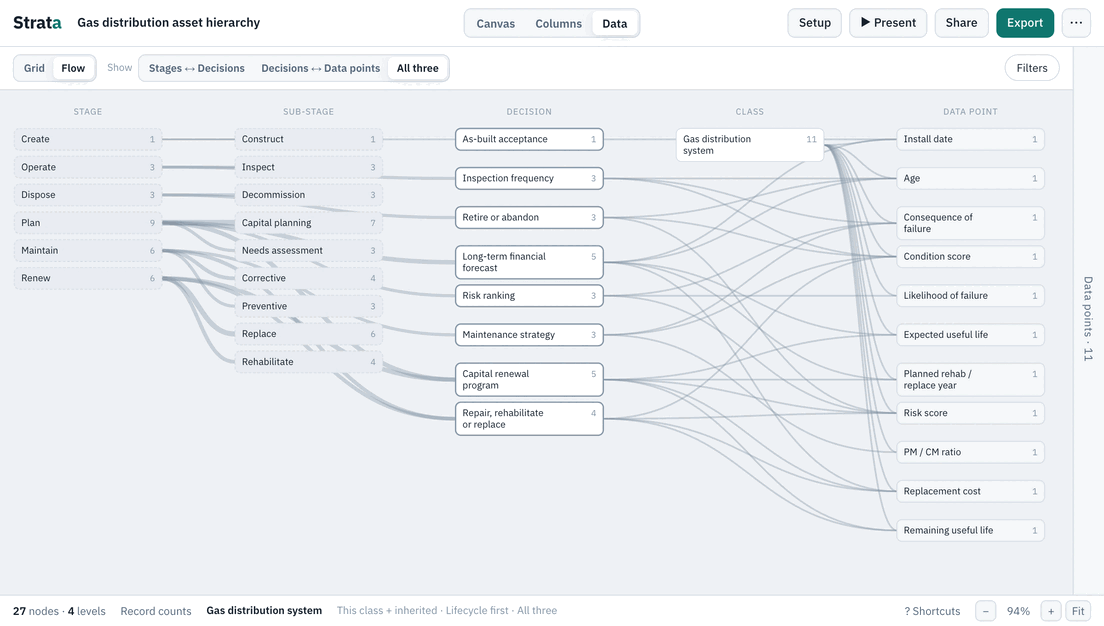
The Flow map
The same template as a Flow map: lifecycle stages, the decisions made in them and the data points each one needs.
How to make it yours
- 01
Rename the levels
Open Setup › Levels and call each level what your organization calls it.
- 02
Add your classes
Add the classes you have that the template does not, or import your own list from Excel. Anything you add inherits the shared data points from its parent.
- 03
Link your own decisions
Open Setup › Decisions to change which decisions each data point feeds and which lifecycle stages they sit in. Gaps are counted for you.
Open the gas distribution template and make it yours.
Opens as your own editable copy. Nothing to sign up for.