Water and Wastewater asset hierarchy template
A worked example of a water and wastewater asset hierarchy: 26 classes in 4 levels, 27 data points and 15 decisions, each linked to the lifecycle stage it supports. It's a starting point built on general industry practice, not on any organization's real data.
Opens as your own editable copy. Nothing to sign up for.
- classes
- 26
- levels
- 4
- data points
- 27
- decisions
- 15
- lifecycle stages
- 6
The levels
4 levels, from the whole network down to the part you maintain. Rename them to suit.
| Level | What it holds |
|---|---|
| 1. System | The whole network or portfolio. Holds the data points every asset shares. |
| 2. Asset group | A family of assets that are managed, budgeted and reported together. |
| 3. Asset class | Assets alike enough to share a design life, an inspection regime and a cost model. |
| 4. Component | A part that is inspected, maintained or replaced on its own schedule. |
The full class outline
Every class, with the data points it defines in italics. A class passes its data points to everything beneath it.
- Water and Wastewater systemEvery asset that treats, moves and returns water.the shared data points below
- Water distributionPipe and devices that carry treated water to customers.Material, Nominal diameter, Break count (10 years)
- Water mainDistribution and transmission pipe.Length
- Service linePipe from the main to the customer meter.Lead status
- ValveIsolation valves on mains.Last exercised date
- HydrantFire hydrants.Flow test result
- Water treatmentPlants that make raw water safe to drink.
- Treatment plantA complete treatment facility.Rated capacity
- FilterRemoves particles.Turbidity
- Chemical feed systemDoses disinfectant and treatment chemicals.
- ClearwellStores treated water before distribution.
- Treatment plantA complete treatment facility.Rated capacity
- Pumping and storagePump stations, tanks and reservoirs.
- Pump stationLifts water or wastewater between pressure zones.Firm capacity
- PumpThe pump and its motor.Wire-to-water efficiency, Run hours
- Variable frequency driveControls pump speed.
- Storage tankElevated tanks and ground reservoirs.Last inspection date
- Pump stationLifts water or wastewater between pressure zones.Firm capacity
- Wastewater collectionSewers that carry wastewater to treatment.
- Gravity sewerPipe that flows by gravity.Structural defect grade, Blockage count (5 years)
- Force mainPressurized sewer pipe from a lift station.
- ManholeAccess structures.
- Lift stationPumps wastewater uphill.
- Wastewater treatmentPlants that treat wastewater before discharge.
- Treatment plantA complete wastewater facility.Permit effluent limit
- Aeration basinBiological treatment.
- ClarifierSettles solids.
- BlowerSupplies air to aeration.
- Treatment plantA complete wastewater facility.Permit effluent limit
- Water distributionPipe and devices that carry treated water to customers.Material, Nominal diameter, Break count (10 years)
The shared data points
11 data points defined once, on Water and Wastewater system, and inherited by every class. Each one carries a reason: the decisions it feeds.
| Data point | Type | Feeds decisions |
|---|---|---|
| Install dateStarts the asset's life clock. Age, remaining life and renewal timing are all calculated from it. | date | As-built acceptance, Long-term financial forecast |
| AgeGroups assets by vintage for inspection planning and replacement forecasting. | number · years | Inspection frequency, Long-term financial forecast, Retire or abandon |
| Expected useful lifeThe design or industry life for this class. Sets when renewal should be planned. | number · years | Long-term financial forecast, Capital renewal program |
| Remaining useful lifeHow long the asset can keep serving. The basis for the renewal year and the repair-or-replace call. | number · years | Capital renewal program, Repair, rehabilitate or replace |
| Condition scoreMeasured physical state, 1 (very good) to 5 (very poor). Drives inspection, maintenance and renewal decisions. | number · 1–5 | Inspection frequency, Maintenance strategy, Repair, rehabilitate or replace, Retire or abandon |
| Likelihood of failureHow likely the asset is to fail, from condition, age and failure history. Half of the risk score. | number · 1–5 | Risk ranking |
| Consequence of failureHow much a failure would cost in safety, service, environment and money. The other half of the risk score. | number · 1–5 | Risk ranking, Inspection frequency, Maintenance strategy |
| Risk scoreLikelihood times consequence. Ranks assets so money goes to the highest risk first. | number · LoF × CoF | Risk ranking, Capital renewal program, Repair, rehabilitate or replace, Retire or abandon |
| Replacement costWhat it would cost to replace today. Feeds the capital plan and the long-term forecast. | number · $ | Capital renewal program, Long-term financial forecast, Repair, rehabilitate or replace |
| Planned rehab / replace yearThe year renewal is planned. Turns risk and remaining life into a schedule and a budget. | number · year | Capital renewal program, Long-term financial forecast |
| PM / CM ratioShare of maintenance hours that were planned rather than reactive. Shows whether the maintenance strategy is working. | number · % | Maintenance strategy |
The decisions, and the lifecycle stages they sit in
9 decisions are shared by every template and 6 are specific to this one. The lifecycle runs Plan, Create, Operate, Maintain, Renew and Dispose.
| Decision | Stages | Kind |
|---|---|---|
| Risk ranking | Plan › Needs assessment | Shared |
| Capital renewal program | Plan › Capital planning, Renew › Replace | Shared |
| Long-term financial forecast | Plan › Capital planning | Shared |
| Design standards | Create › Design | Shared |
| As-built acceptance | Create › Construct | Shared |
| Inspection frequency | Operate › Inspect | Shared |
| Maintenance strategy | Maintain › Preventive | Shared |
| Repair, rehabilitate or replace | Maintain › Corrective, Renew › Rehabilitate, Renew › Replace | Shared |
| Retire or abandon | Dispose › Decommission | Shared |
| Main break response | Maintain › Corrective | Industry |
| Pipe renewal priority | Plan › Needs assessment, Renew › Replace | Industry |
| Pump overhaul timing | Maintain › Preventive, Renew › Rehabilitate | Industry |
| Sewer cleaning schedule | Maintain › Preventive | Industry |
| Hydrant and valve exercising | Operate › Inspect | Industry |
| Process monitoring | Operate › Monitor | Industry |
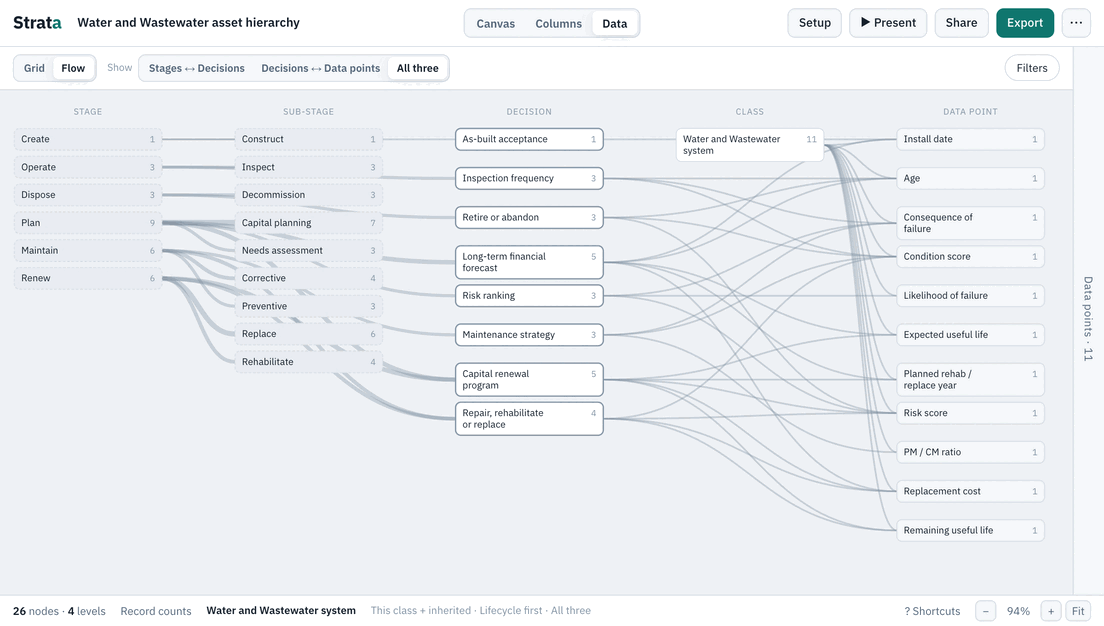
The Flow map
The same template as a Flow map: lifecycle stages, the decisions made in them and the data points each one needs.
How to make it yours
- 01
Rename the levels
Open Setup › Levels and call each level what your organization calls it.
- 02
Add your classes
Add the classes you have that the template does not, or import your own list from Excel. Anything you add inherits the shared data points from its parent.
- 03
Link your own decisions
Open Setup › Decisions to change which decisions each data point feeds and which lifecycle stages they sit in. Gaps are counted for you.
Open the water and wastewater template and make it yours.
Opens as your own editable copy. Nothing to sign up for.