For asset management & asset data teams
Know why every asset data point exists.
Build your asset hierarchy, give each class the data it needs, and link every data point to the decision it serves and the lifecycle stage it supports. Then share one link your whole team trusts.
No sign-up · start from a sample or an industry template · your work stays in your browser until you choose to share it
Works with the files you already have
- Excel inPaste the cells straight from a sheet.
- PowerPoint in and outEvery node stays an editable shape.
- JSON in and outThe whole record, and it round-trips.
- CSV outClasses and data points, ready for your schema.
Templates
Start from your industry
Each template is a complete worked example: classes, data points, decisions and lifecycle stages already linked. Open it, then make it yours.
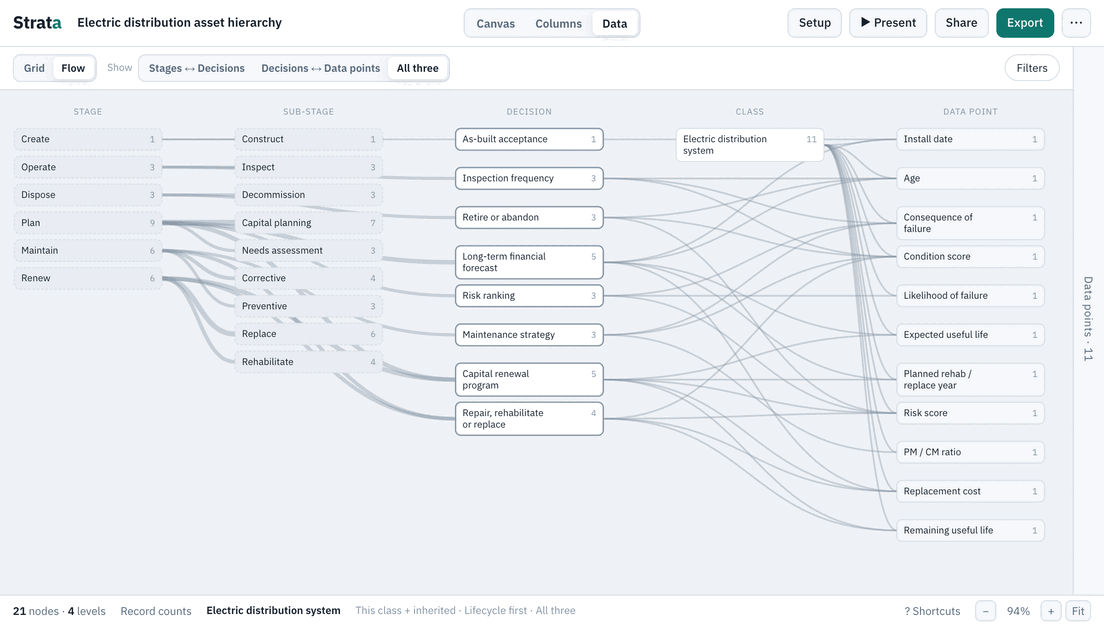
Electric distribution
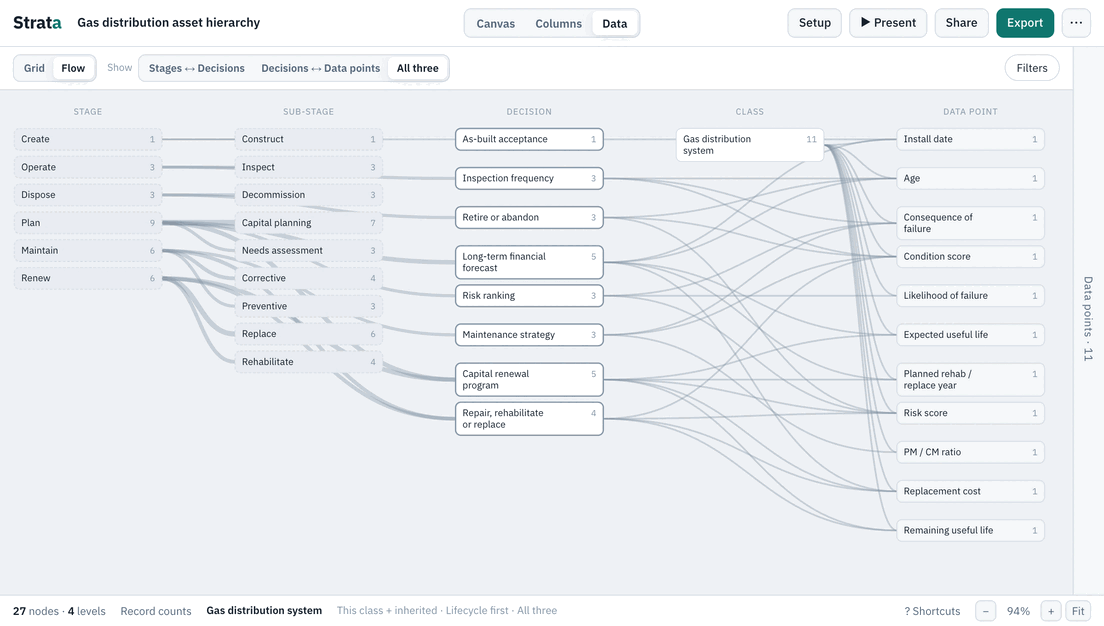
21 classes · 23 data points · 14 decisionsOpen templateGas distribution
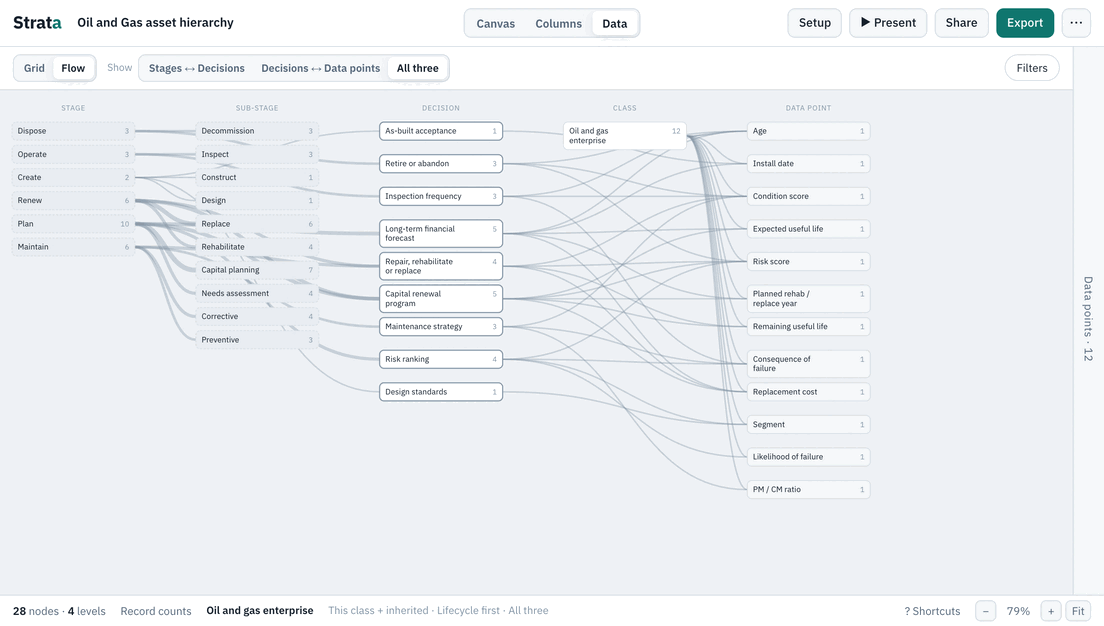
27 classes · 33 data points · 14 decisionsOpen templateOil and Gas
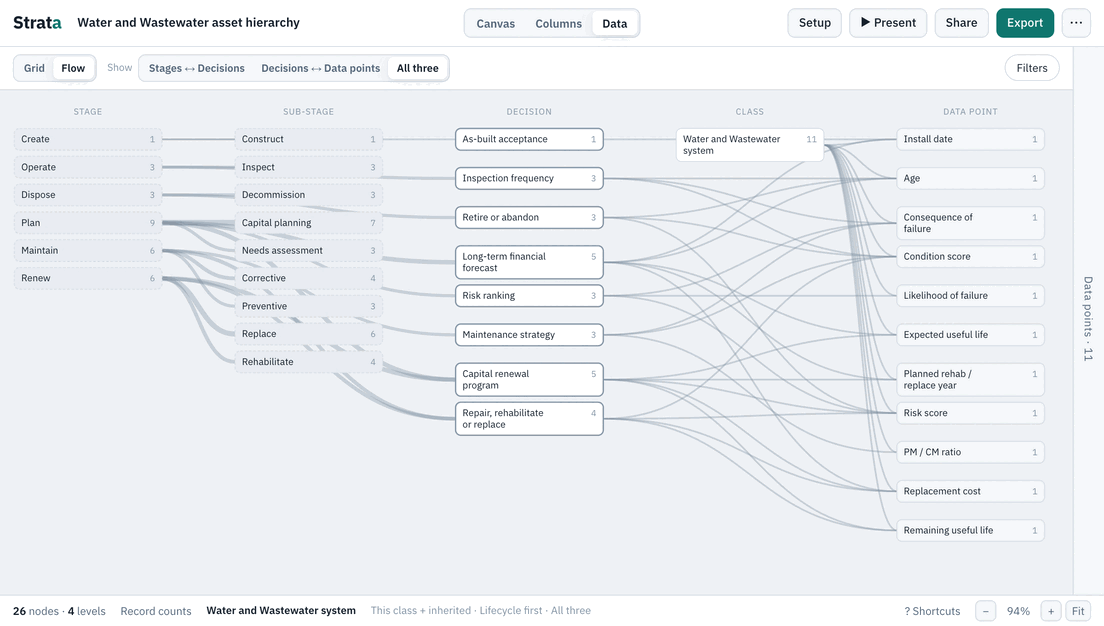
28 classes · 23 data points · 15 decisionsOpen templateWater and Wastewater
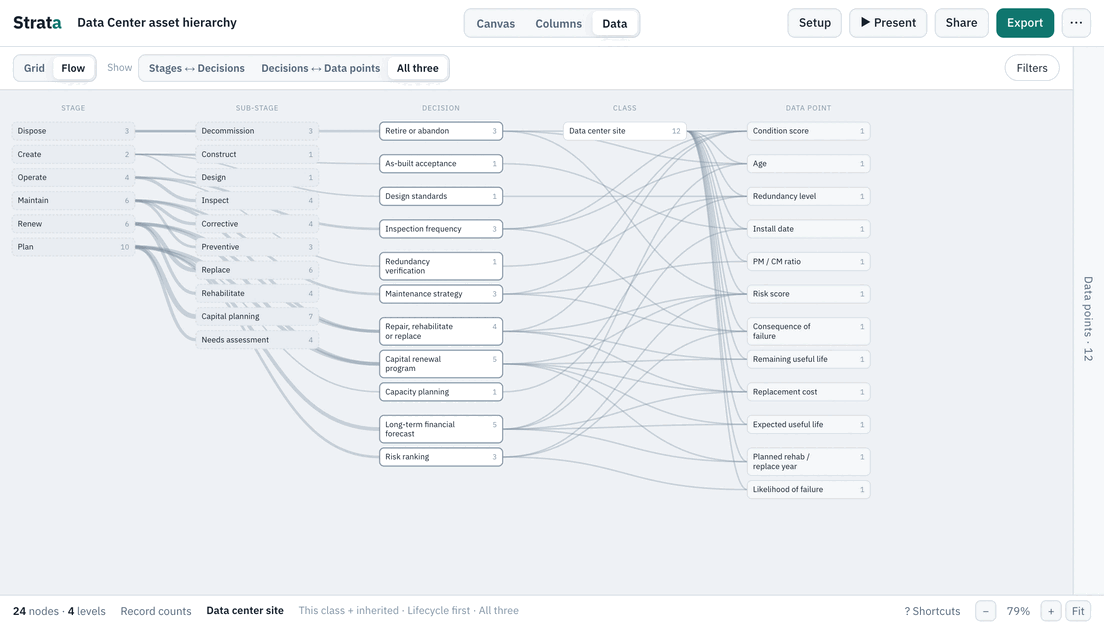
26 classes · 27 data points · 15 decisionsOpen templateData Center
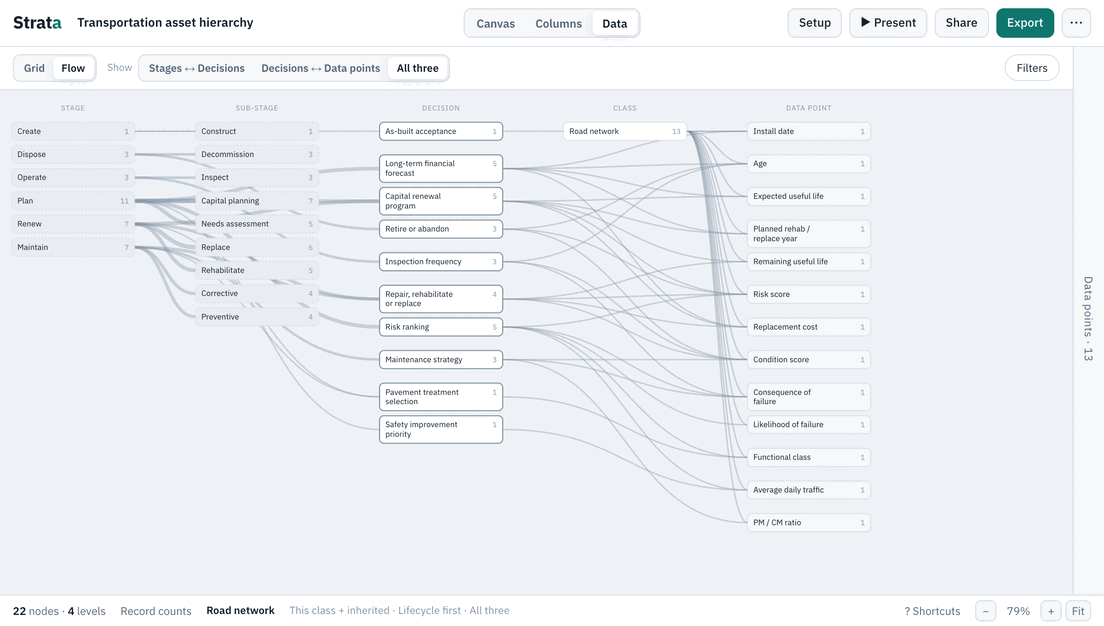
24 classes · 21 data points · 14 decisionsOpen templateTransportation
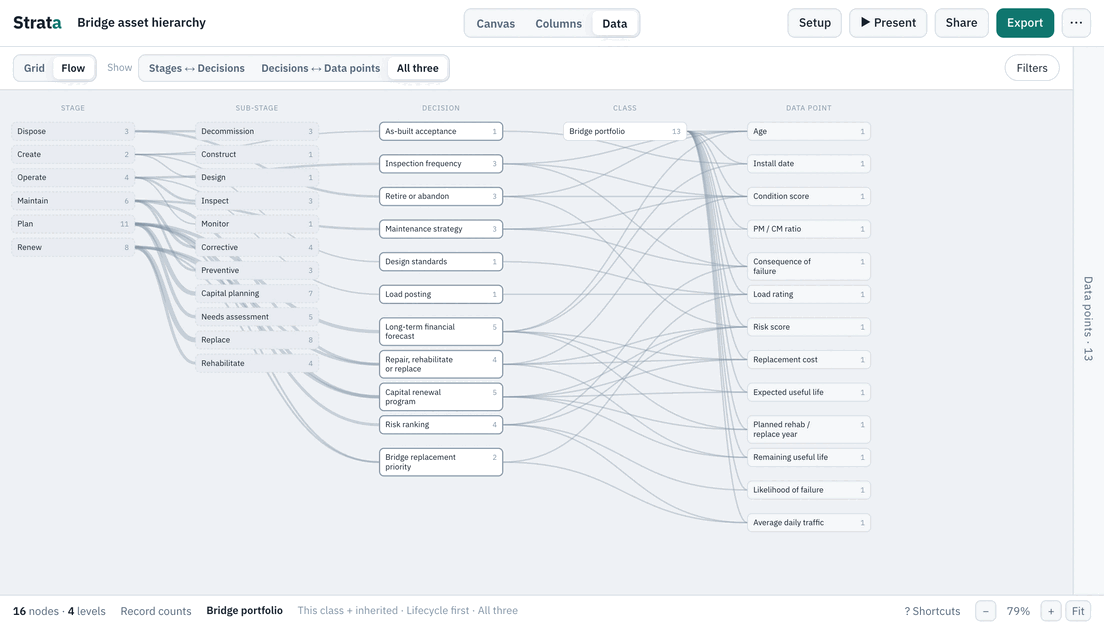
22 classes · 24 data points · 14 decisionsOpen templateBridge
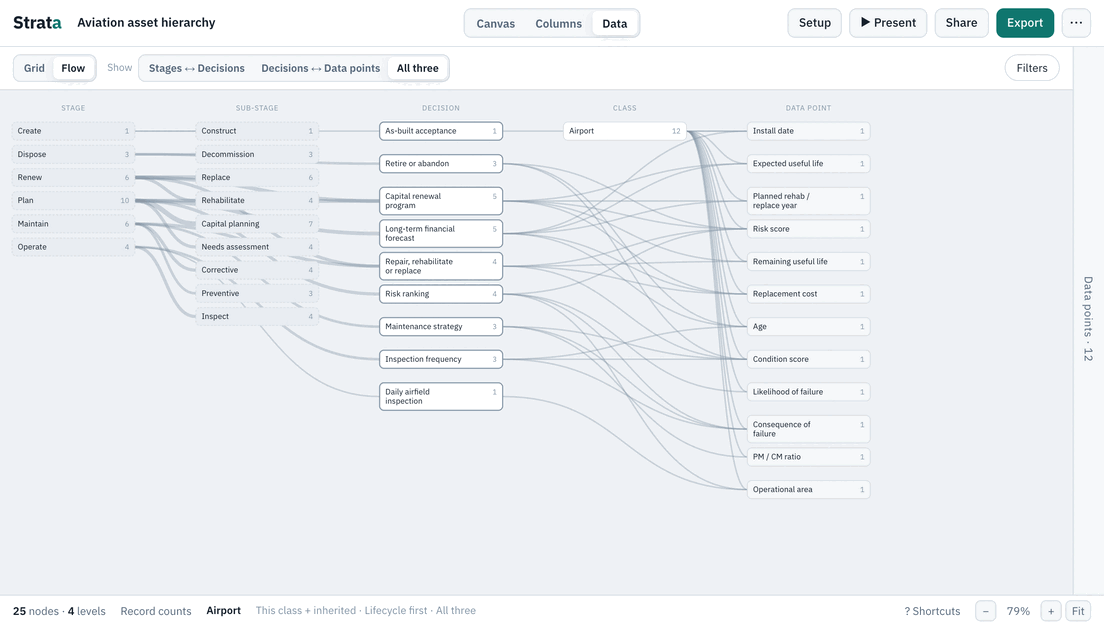
16 classes · 21 data points · 14 decisionsOpen templateAviation
25 classes · 23 data points · 15 decisionsOpen templateHow it works
From a spreadsheet to a standard your team trusts
-
01
Build the hierarchy.
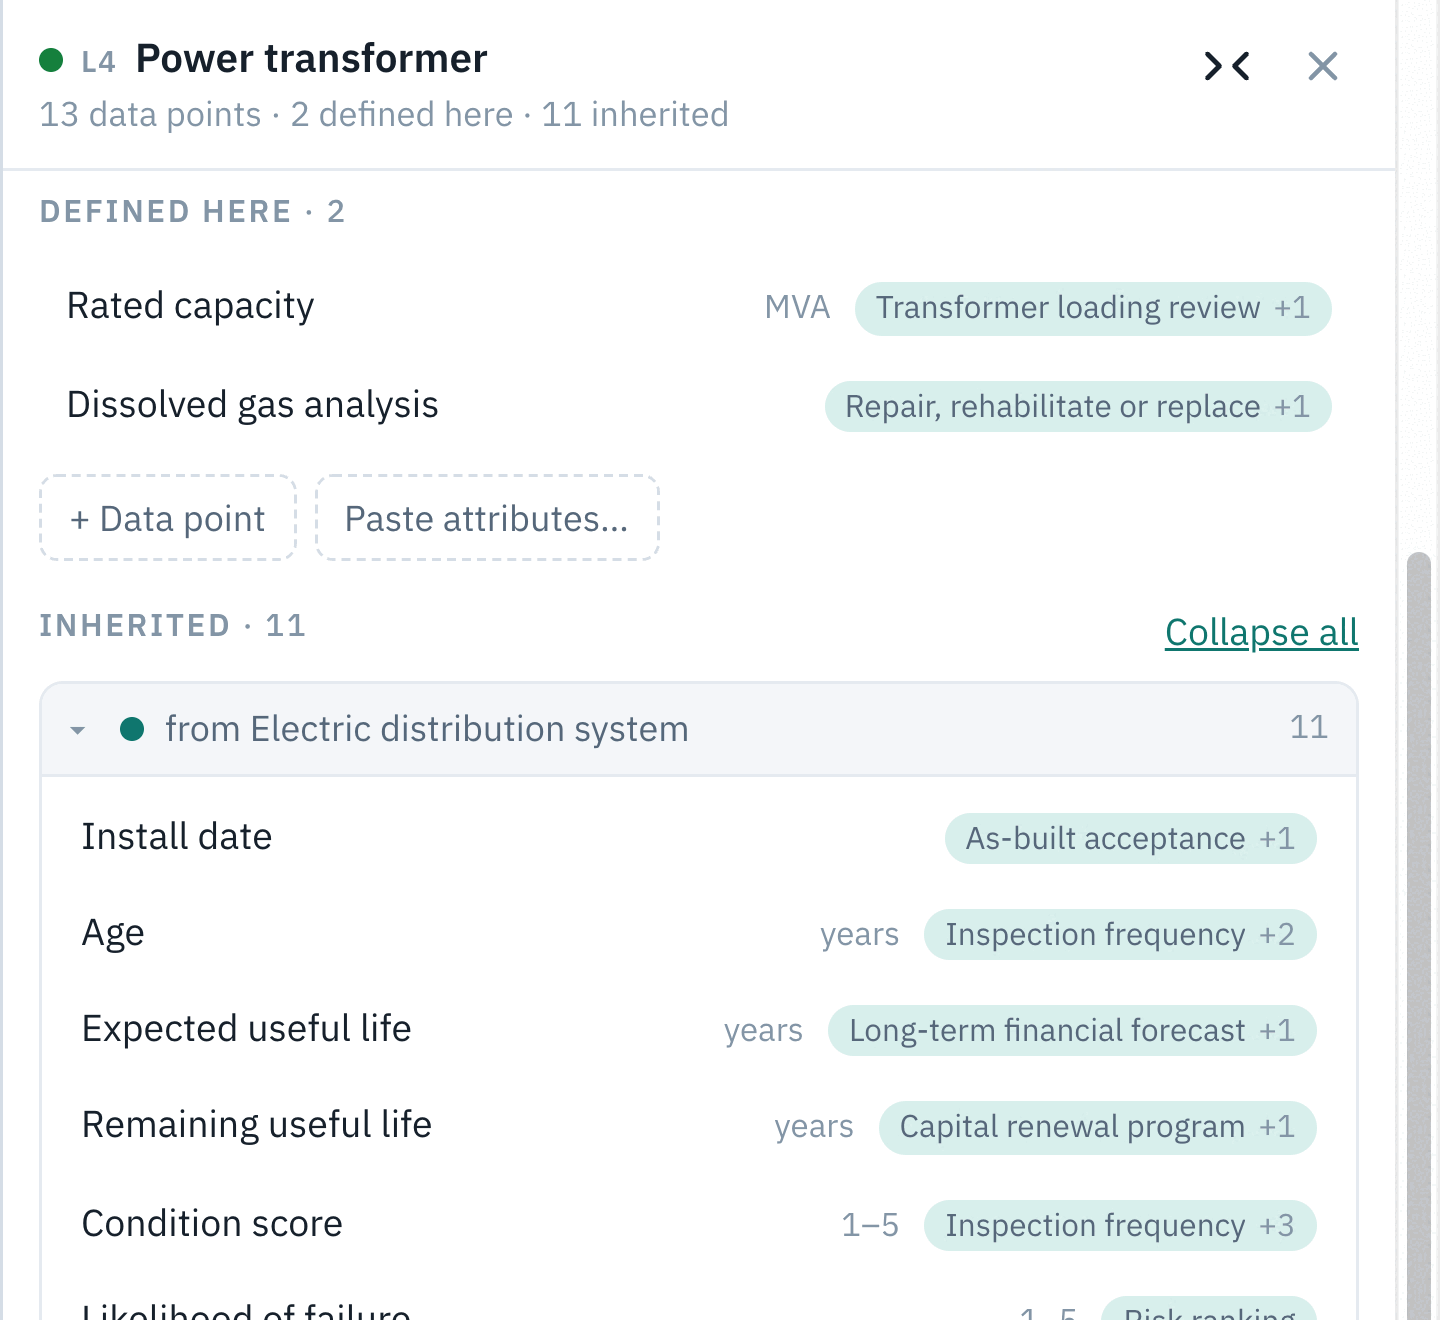
Import from Excel or start from a template. Classes inherit data points from their parents, so you define Install date once and it applies everywhere.
-
02
Give every data point a reason.
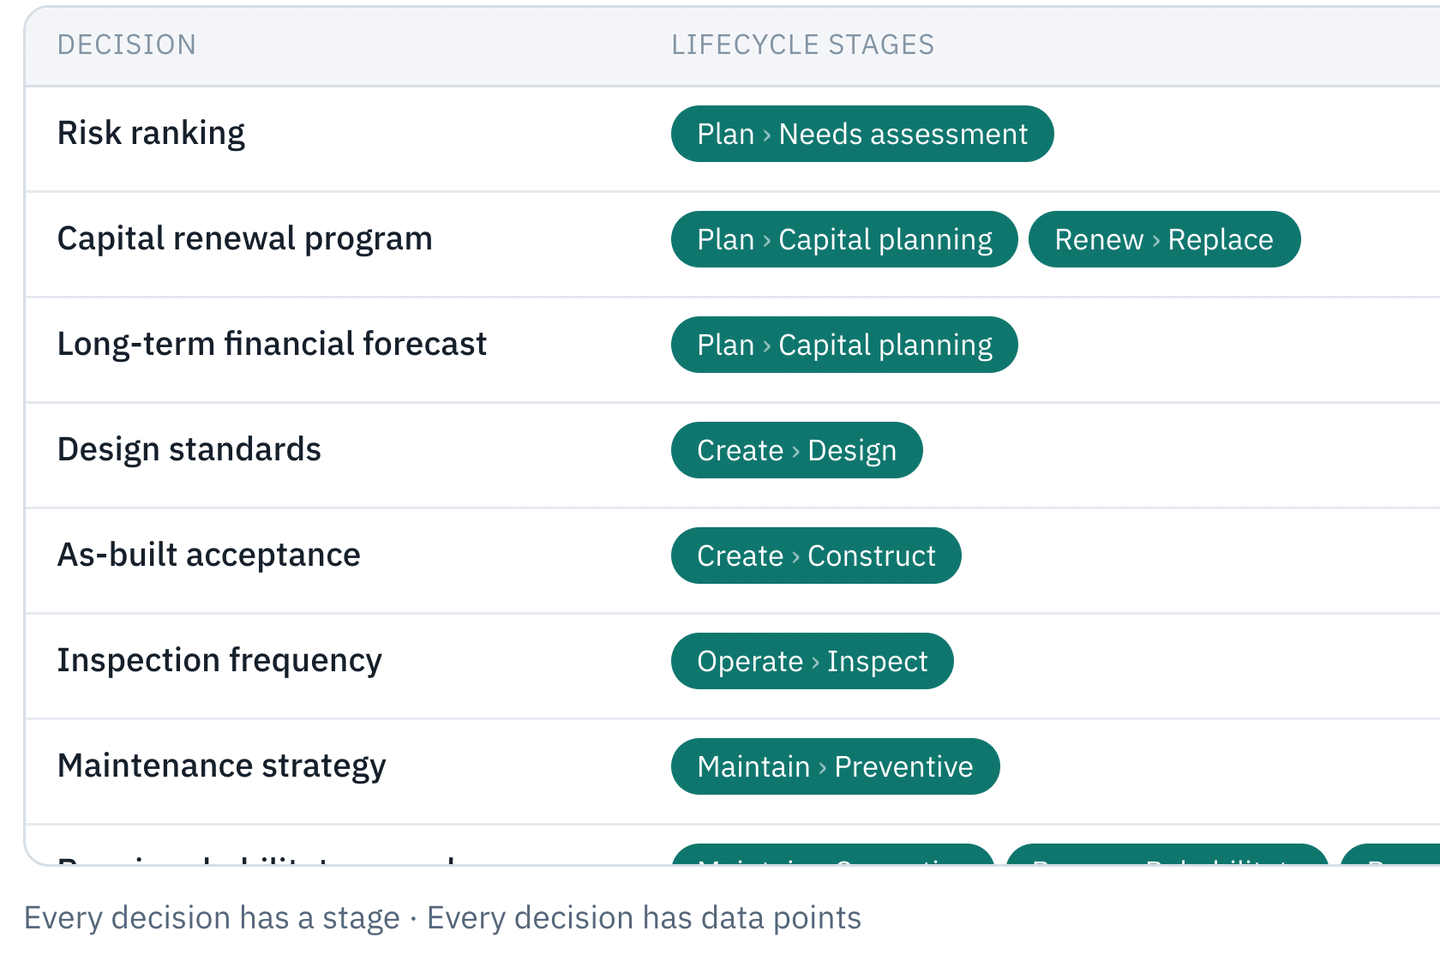
A purpose, the decisions it feeds, the system it lives in today and where it should move. Gaps are named and counted.
-
03
See it, present it, share it.
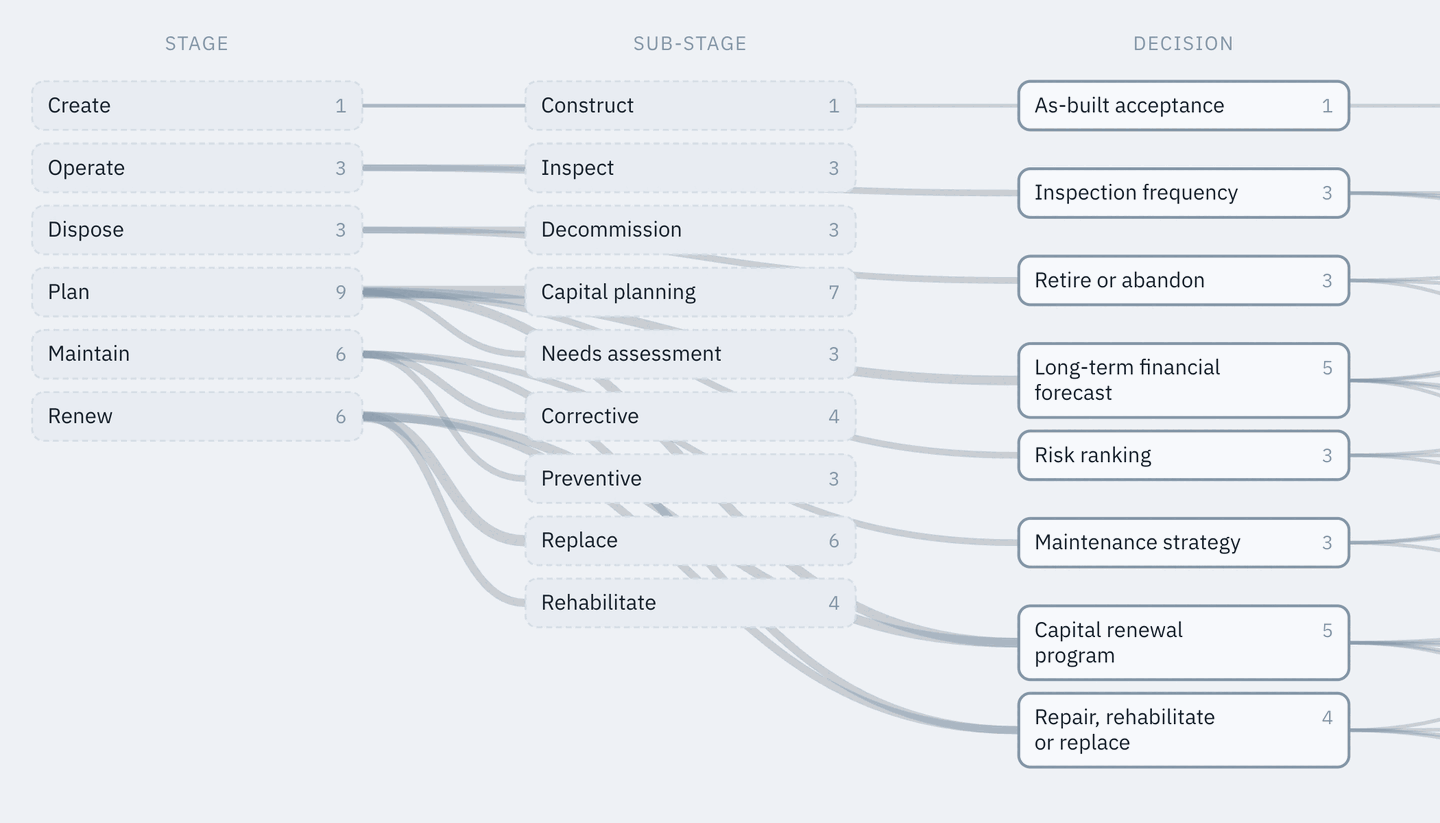
The Flow map shows lifecycle stage → decision → data point. Present it in the meeting, export it as an editable PowerPoint, or share one link.
Learn more: what is an asset hierarchy? New here? Start here
A worked example, from the Electric distribution templateCondition score feeds Repair, rehabilitate or replace which happens in Maintain › Corrective, Renew › Rehabilitate and Renew › Replace.
What it replaces
Instead of the spreadsheet, the inbox and the redraw
- Instead of…
A spreadsheet that only its author understandsA hierarchy where every data point says why it's there - Instead of…
EmailingOne link that always shows the latest named version, with historyhierarchy_v7_FINAL.xlsx - Instead of…
Redrawing slides after every workshopEditable PowerPoint and JSON/CSV out of the same structure, no redrawing
Data handling
Where your data lives
Your work stays in your browser until you share it.
Shared links are password-protected and hidden from search.
Download everything as JSON at any time.
What Strata isn't
It's not an asset register or an EAM. It describes what you record about each kind of asset and why. Your systems still hold the records. Strata is where you agree the standard they follow.
I built the tool I always wanted.