Oil and Gas asset hierarchy template
A worked example of an oil and gas asset hierarchy: 28 classes in 4 levels, 23 data points and 15 decisions, each linked to the lifecycle stage it supports. Gas distribution, the pipes that deliver gas to customers, sits downstream of the midstream segment shown here and has its own template. It's a starting point built on general industry practice, not on any organization's real data.
Opens as your own editable copy. Nothing to sign up for.
- classes
- 28
- levels
- 4
- data points
- 23
- decisions
- 15
- lifecycle stages
- 6
The levels
4 levels, from the whole network down to the part you maintain. Rename them to suit.
| Level | What it holds |
|---|---|
| 1. Enterprise | The whole company. Holds the data points every asset shares. |
| 2. Segment | Upstream, midstream or downstream: the industry's own top-level split. |
| 3. Facility or system | A well, plant, station or pipeline system managed as one unit. |
| 4. Equipment | Equipment alike enough to share a design life, a maintenance regime and a cost model. |
The full class outline
Every class, with the data points it defines in italics. A class passes its data points to everything beneath it.
- Oil and gas enterpriseAssets from the reservoir to the customer, across all three segments.the shared data points below
- UpstreamExploration and production: wells and the facilities that gather and separate what they produce.Production rate
- WellA producing or injection well.Well status, Annulus pressure
- Wellhead and treeValves and spools at the surface.
- Artificial liftRod pumps, ESPs or gas lift.Run life
- Production facilitySeparation, treating and storage at the lease or platform.
- SeparatorSplits oil, gas and water.
- Storage tankLease crude and water tanks.Emission controls fitted
- FlareBurns gas that can't be sold or used.
- Gathering lineFlowlines from wells to the facility.
- WellA producing or injection well.Well status, Annulus pressure
- MidstreamMoving and storing: transmission pipelines, compressor stations, processing and storage.
- Transmission pipelineLong-distance, high-pressure pipe.Maximum operating pressure, High consequence area, Last in-line inspection date
- Pipe segmentA length of pipe between valves.
- Mainline valveBlock valves for isolation.
- Pig launcher and receiverWhere in-line inspection tools enter and leave.
- Compressor stationKeeps gas moving along the pipeline.
- CompressorReciprocating or centrifugal unit.Availability
- DriverGas engine, turbine or motor.
- Gas processing plantRemoves liquids and impurities.
- StorageUnderground and tank storage.
- Transmission pipelineLong-distance, high-pressure pipe.Maximum operating pressure, High consequence area, Last in-line inspection date
- DownstreamRefining and delivering products.
- RefineryTurns crude into products.Unit throughput
- Process unitDistillation, cracking, reforming and similar units.
- Pressure vesselColumns, drums and reactors.Remaining wall thickness
- Heat exchangerTransfers heat between streams.
- Rotating equipmentPumps and compressors.
- TerminalProduct storage and loading.
- Product pipelinePipes moving refined products.
- RefineryTurns crude into products.Unit throughput
- UpstreamExploration and production: wells and the facilities that gather and separate what they produce.Production rate
The shared data points
12 data points defined once, on Oil and gas enterprise, and inherited by every class. Each one carries a reason: the decisions it feeds.
| Data point | Type | Feeds decisions |
|---|---|---|
| Install dateStarts the asset's life clock. Age, remaining life and renewal timing are all calculated from it. | date | As-built acceptance, Long-term financial forecast |
| AgeGroups assets by vintage for inspection planning and replacement forecasting. | number · years | Inspection frequency, Long-term financial forecast, Retire or abandon |
| Expected useful lifeThe design or industry life for this class. Sets when renewal should be planned. | number · years | Long-term financial forecast, Capital renewal program |
| Remaining useful lifeHow long the asset can keep serving. The basis for the renewal year and the repair-or-replace call. | number · years | Capital renewal program, Repair, rehabilitate or replace |
| Condition scoreMeasured physical state, 1 (very good) to 5 (very poor). Drives inspection, maintenance and renewal decisions. | number · 1–5 | Inspection frequency, Maintenance strategy, Repair, rehabilitate or replace, Retire or abandon |
| Likelihood of failureHow likely the asset is to fail, from condition, age and failure history. Half of the risk score. | number · 1–5 | Risk ranking |
| Consequence of failureHow much a failure would cost in safety, service, environment and money. The other half of the risk score. | number · 1–5 | Risk ranking, Inspection frequency, Maintenance strategy |
| Risk scoreLikelihood times consequence. Ranks assets so money goes to the highest risk first. | number · LoF × CoF | Risk ranking, Capital renewal program, Repair, rehabilitate or replace, Retire or abandon |
| Replacement costWhat it would cost to replace today. Feeds the capital plan and the long-term forecast. | number · $ | Capital renewal program, Long-term financial forecast, Repair, rehabilitate or replace |
| Planned rehab / replace yearThe year renewal is planned. Turns risk and remaining life into a schedule and a budget. | number · year | Capital renewal program, Long-term financial forecast |
| PM / CM ratioShare of maintenance hours that were planned rather than reactive. Shows whether the maintenance strategy is working. | number · % | Maintenance strategy |
| SegmentUpstream, midstream or downstream: sets the regulator, the integrity program and the reporting line. | enum | Risk ranking, Design standards |
The decisions, and the lifecycle stages they sit in
9 decisions are shared by every template and 6 are specific to this one. The lifecycle runs Plan, Create, Operate, Maintain, Renew and Dispose.
| Decision | Stages | Kind |
|---|---|---|
| Risk ranking | Plan › Needs assessment | Shared |
| Capital renewal program | Plan › Capital planning, Renew › Replace | Shared |
| Long-term financial forecast | Plan › Capital planning | Shared |
| Design standards | Create › Design | Shared |
| As-built acceptance | Create › Construct | Shared |
| Inspection frequency | Operate › Inspect | Shared |
| Maintenance strategy | Maintain › Preventive | Shared |
| Repair, rehabilitate or replace | Maintain › Corrective, Renew › Rehabilitate, Renew › Replace | Shared |
| Retire or abandon | Dispose › Decommission | Shared |
| Well integrity management | Operate › Monitor, Maintain › Corrective | Industry |
| Pipeline integrity assessment | Operate › Inspect, Plan › Needs assessment | Industry |
| Turnaround scope | Plan › Capital planning, Maintain › Preventive | Industry |
| Risk-based inspection interval | Operate › Inspect | Industry |
| Plug and abandon | Dispose › Decommission | Industry |
| Leak detection and repair | Operate › Monitor, Maintain › Corrective | Industry |
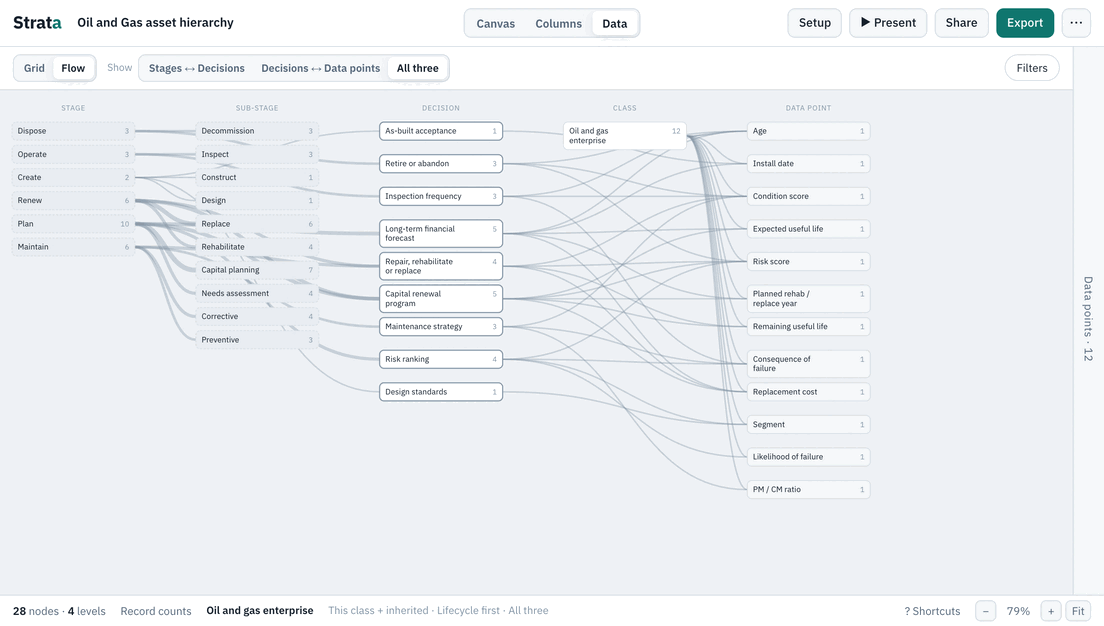
The Flow map
The same template as a Flow map: lifecycle stages, the decisions made in them and the data points each one needs.
How to make it yours
- 01
Rename the levels
Open Setup › Levels and call each level what your organization calls it.
- 02
Add your classes
Add the classes you have that the template does not, or import your own list from Excel. Anything you add inherits the shared data points from its parent.
- 03
Link your own decisions
Open Setup › Decisions to change which decisions each data point feeds and which lifecycle stages they sit in. Gaps are counted for you.
Open the oil and gas template and make it yours.
Opens as your own editable copy. Nothing to sign up for.