Asset data readiness for analytics
Asset data readiness for analytics comes down to one check: do you have the data points the analytics will need? Start from the decision and work backward. The gaps you find are the answer.
Published 2026-10-09 · Theory only: general industry knowledge, no client data.
The question
Plenty of organizations buy or build analytics first and find out afterward that the data behind them is thin. Ask the better question earlier: do we have the data points the analytics behind our decisions would need? Answered before anyone builds a model, that costs a conversation. Answered afterward, it costs a project.
The method: five steps, working backward
- 01
Start from the decision
Pick one decision you want to make better, in words a manager would use. Not “improve data”, but “decide which pipes to replace this year”.
- 02
List the analytics it needs
Ask what you would have to calculate or compare to make that decision well. A ranking, an estimate of remaining life, a cost comparison. These are the analytics, and they do not have to exist yet.
- 03
List the data points those need
For each calculation, name the inputs. Be specific about the unit and how current it must be.
- 04
Check which you have
For each data point, ask whether it is captured, whether you trust it and whether it covers every class that matters. Be honest: partly captured is not captured.
- 05
Read the gaps
The data points you do not have, or do not trust, are the answer. They are the work between you and the analytics. Everything else can wait.
It starts at the decision, not the data. Start from the data you already have and you tend to get analytics that answer easy questions nobody asked.
Put two people in the room: the one who makes the decision and the one who knows how the data is really captured. The first says what the analysis must tell them. The second says, without embarrassment, which values are guesses. Most of the useful findings come from the gap between what each assumed.
A worked example: repair, rehabilitate or replace
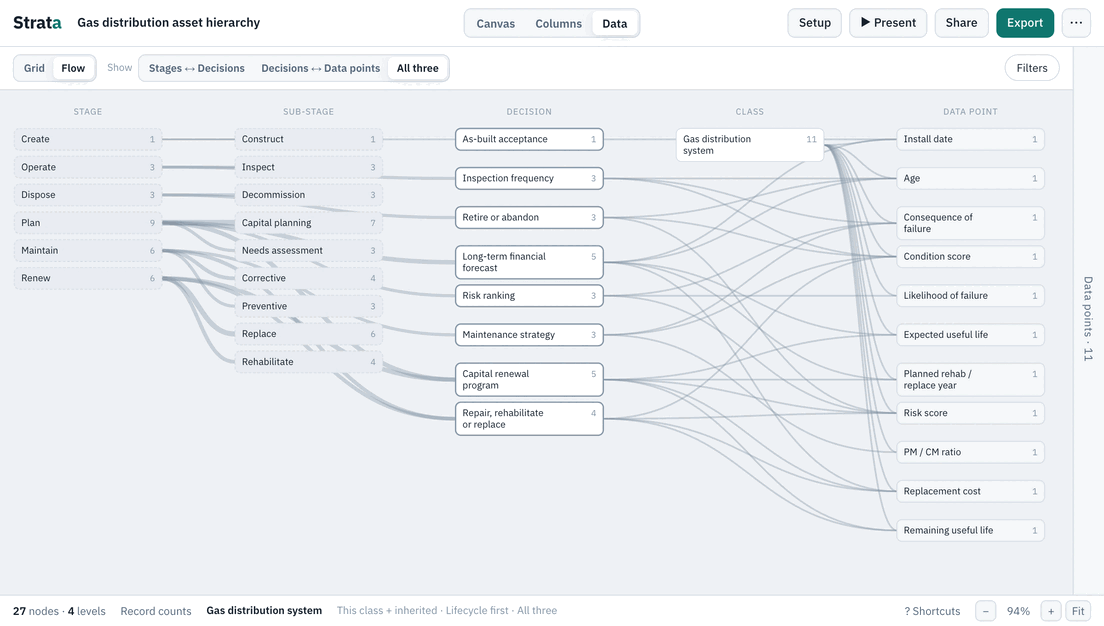
The Gas distribution template includes the decision Repair, rehabilitate or replace, which happens in Maintain › Corrective, Renew › Rehabilitate, Renew › Replace. Four shared data points feed it.
| Data point | What the analysis uses it for |
|---|---|
| Condition score | How worn the asset is now, from inspection |
| Remaining useful life | How long it can be expected to serve if left alone |
| Replacement cost | What replacing it would cost, to compare with repairing it |
| Risk score | How likely a failure is and how bad it would be, combined into one number |
The analytics are modest: rank assets by risk, compare remaining life with the capital plan, weigh repair cost against replacement cost. None of it works if condition scores exist for a third of the assets, or if nobody trusts the replacement costs. Risk score is built from two more data points, Likelihood of failure and Consequence of failure, so the check has to reach them too.
Finding the gaps in Strata
Strata shows where the data falls short in two ways, and they look at opposite sides of the same problem.
- Current state is a field on each data point with four answers: captured and trusted, captured but needs cleanup, partly captured, and not captured. It starts blank on every data point in a template, and filling it in is the exercise. Filter the data points to Repair, rehabilitate or replace and set it on each. Anything short of captured and trusted is a gap you will hit before the analysis works.
- The “no decision” chip marks a data point that feeds no decision. That is the reverse gap: data collected that nobody uses. Retire those and you free field time to close the first kind.
The terms are defined in the glossary, and the same idea of working from a decision is applied to a water-sector framework in the guide on Effective Utility Management data.
What “ready” means for a data point
Having a column is not the same as having data. A data point is ready for an analysis when four things are true.
- It is captured. There is a value, not a blank or a placeholder.
- It is trusted. The people who would act on the result believe it.
- It covers the classes that matter. A condition score for half the pipes ranks half the pipes.
- It is usable. The unit and scale are known, and it is current enough for the decision.
The four answers in Strata’s Current state field are a short way of saying how many of these are true.
Then do it for the next decision
Do the same for a second decision and the overlap shows where to spend effort first. In the gas template, Condition score feeds four decisions, so closing the gap on that one data point helps all of them. Data points that feed only one decision can wait their turn.
Three traps come up often. Waiting for perfect data stalls everything, and you only need data good enough for the decision. Measuring completeness over the records you happen to look at flatters the result. And fixing a data point technically when the real problem is ownership, with nobody responsible for keeping it current, brings the gap straight back.
The step before analytics
Strata is not an analytics tool. It does not calculate risk or forecast renewals. It is the step before: a place to set out the decisions, the data points they need and the state of each, so whatever analytics you build or buy later start from something agreed. To work through the example above, open the gas distribution template, go to its data points and filter by the decision.
Related guides
- What is an asset hierarchy? The pillar: levels, classes and instances, common patterns, and the mistakes to avoid.
- Hierarchy, EAM, CMMS and GIS Taking an agreed hierarchy into the systems, and keeping them aligned.
- Hierarchy vs. relationships Classification, connections and decisions are three different questions.
- Asset data glossary Plain definitions of the terms the templates use.