Is your asset data ready for AI?
AI-ready asset data takes more than having the columns. An assistant can only answer a business question if the right data points exist and each one arrives with its context: why it exists, which decision it feeds and when in the lifecycle it is used.
Published 2026-10-09 · Theory only: general industry knowledge, no client data.
A column is not meaning
Ask an assistant or an analyst “which pipes should we renew first?” and two things must be true before the answer is worth reading. The data points that bear on the question have to exist. And each one needs enough context to be used correctly. Most of the attention goes to the first. The second is where answers quietly go wrong.
A spreadsheet export gives you a header like BRK_10 and a column of numbers. Someone who has worked in the department can guess it means breaks over ten years. A model, or an analyst new to the team, is only guessing. Now picture two hundred columns, several renamed in different years. Every answer rests on assumptions nobody wrote down.
The context a data point needs
Four pieces of context turn a column into something that can be reasoned with.
- Why it exists. One sentence on what the value tells you. It separates two fields that look alike and stops a field being used for something it was never meant to show.
- Which decision it feeds. The choice somebody actually makes with it. That is how a model can rank importance, or see that a field matters to three decisions and not just one.
- When in the lifecycle it is used. Planning, building, operating and renewing use the same data differently. A value that is a design input at one stage is a performance measure at another.
- Where it comes from and in what unit. The source, the unit, and how far to trust it.
None of this is exotic. A good data dictionary holds the same things. The difference here is that each item is tied to the decision it serves and the stage where that decision is made, so the meaning travels with the data instead of sitting in somebody’s head.
A worked example: which pipes do we renew first?
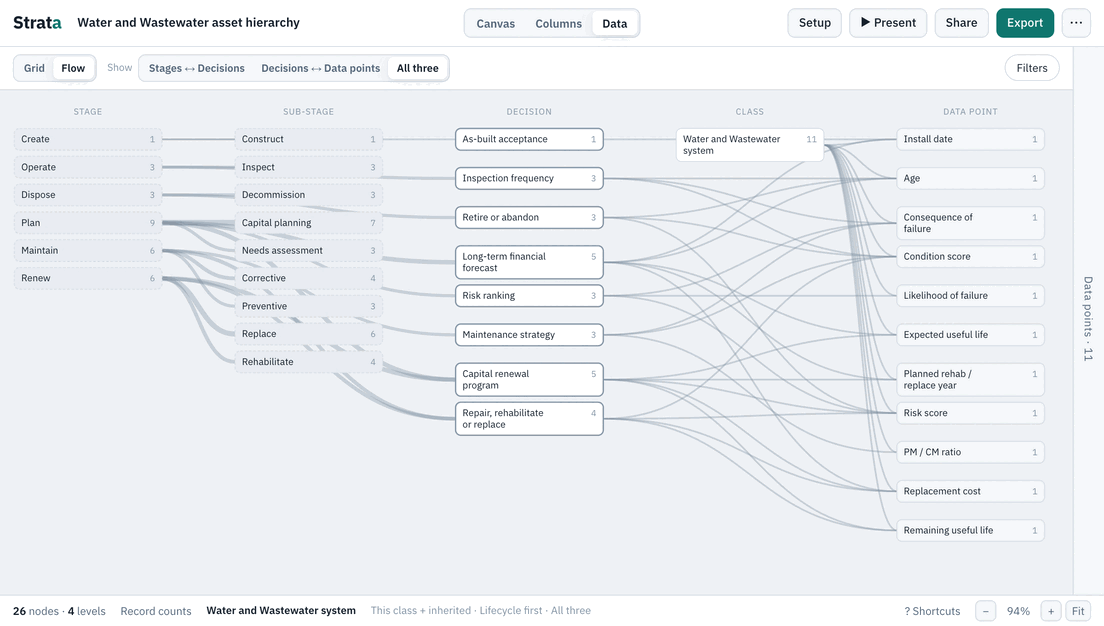
Take the question as leadership might put it: which pipes should we renew first? The Water and Wastewater template holds a decision for exactly this, Pipe renewal priority. The template records its frequency (annual), its decision maker (engineer / analyst), the stages it sits in (Plan › Needs assessment and Renew › Replace) and what sets it off (condition threshold, capital or project plan). That is already more than a column list can say: who decides, how often, and what sets it off.
Four data points feed it. Here is the context the template records for each one.
| Data point | On the class | Why it exists | Where it comes from | Also feeds |
|---|---|---|---|---|
| Material | Water distribution | Material drives break rates and which renewal program the pipe belongs to. | Design records / as-built | Design standards |
| Break count (10 years) (breaks) | Water distribution | Break history is the strongest predictor of the next break. | Field inspection | Risk ranking |
| Lead status | Service line | Known, suspected or confirmed lead lines must be found and replaced. | Field inspection and Design records / as-built | Design standards |
| Structural defect grade (1–5) | Gravity sewer | Graded from CCTV inspection; drives rehab or replacement. | Field inspection | Repair, rehabilitate or replace |
Read the second row the way a model would. Break count (10 years) is a count of breaks, taken from field records, and it exists because break history is the strongest predictor of the next break. It feeds Pipe renewal priority and also Risk ranking. So when the question is about renewal order, the field is no longer an anonymous number. It is the strongest evidence for one specific choice, and the reason is on the record.
Notice, too, that the four points sit on different classes: the water main, the service line and the gravity sewer. A flat export of one table would drop some of them. A hierarchy keeps them attached to the right kind of asset, so “which pipes?” can mean all pipes and still be answered one class at a time.
How answers go wrong without it
- Look-alike fields get mixed up. Two age columns, one from install date and one from a survey, give two different rankings.
- Units get guessed. A diameter in inches read as millimeters changes every result built on it.
- Nobody sees what is missing. If a data point the decision needs is absent, the model still answers, using whatever is nearby. The gap is invisible.
- Noise looks like signal. Data collected for no decision gets the same weight as data that matters, because nothing says otherwise.
Context does not guarantee a good answer. It gives the answer something to stand on, and it lets a person check the reasoning against the definitions.
Preparing asset data, step by step
- 01
Name the decisions
List the choices your organization makes about its assets, in the words managers use. Five or six is enough to start.
- 02
Attach the data points
For each decision, name the data points it needs and the class each belongs to. Define each once, on the highest class where it applies, so every class beneath inherits it.
- 03
Write the context
For every data point: a purpose in one sentence, a unit, a source and how critical it is. Reject any data point you cannot explain.
- 04
Mark what you actually have
Record whether each is captured and trusted, needs cleanup, is only partly captured or is missing. This is the honest part, and it is what tells you where an assistant will be guessing.
- 05
Fix the gaps that matter
Work first on the missing data points that feed the most decisions. Retire the ones that feed none.
The analytics readiness guide goes deeper on steps four and five, and the glossary defines the terms.
Where Strata fits
Strata is the preparation step. It holds the hierarchy, the decisions, the data points with their context, and the current state of each, in one model you can share. It is not an AI tool and does not analyze your records. What comes out is a description of the data you have and why it exists: an editable PowerPoint, and JSON or CSV that any data team, or any tool you pick later, can read as a dictionary. To see the example above in context, open the water and wastewater template and click a data point to see its purpose and the decisions it feeds.
Related guides
- What is an asset hierarchy? The pillar: levels, classes and instances, common patterns, and the mistakes to avoid.
- Data readiness for analytics Start from the decision, and find the data you are missing.
- Asset data glossary Plain definitions of the terms the templates use.
- Can your EAM data answer leadership? Start from the questions leadership asks and check the data behind each.
- Lifecycle stages and PCOAR How PCOAR maps to six plain-English stages.