Can your EAM data answer leadership’s questions?
Can your EAM data answer leadership’s questions? Leadership asks many of them, and each needs different data points. Start from the questions, trace them to the data, and only then check what your systems hold.
Published 2026-10-09 · Theory only: general industry knowledge, no client data.
What a drill-through cannot tell you
Open an enterprise asset management system (EAM) or a maintenance system (CMMS) and you can drill from a class of asset down to its records. That is useful, and it answers one question: what do we hold? It cannot tell you what leadership cares about, which is whether what you hold is what the decisions need.
This guide describes a different check. It starts from the questions people at the top actually ask, works down to the data each one needs, and only then looks at what your systems contain. The drill-through shows what you have. This shows what you should have, and why. It works the same whichever product you run, so nothing here is tied to one.
The method
- 01
List the questions
Write down what executives, boards, regulators and finance really ask, in their words. Gather them from meeting minutes and budget cycles, not from a guess.
- 02
Map each question to a decision
Behind every question is a choice: fund this, inspect that, retire the other. Name the decision, who makes it and how often.
- 03
Map each decision to its data points
List what a careful person would need to see before deciding, with the class of asset each belongs to.
- 04
Check what the systems hold
For each data point: is it captured, is it trusted, does it cover the assets that matter, and is it current enough?
- 05
Read the pattern of gaps
The finding is where the questions and the data do not meet.
Leadership asks many questions, not one
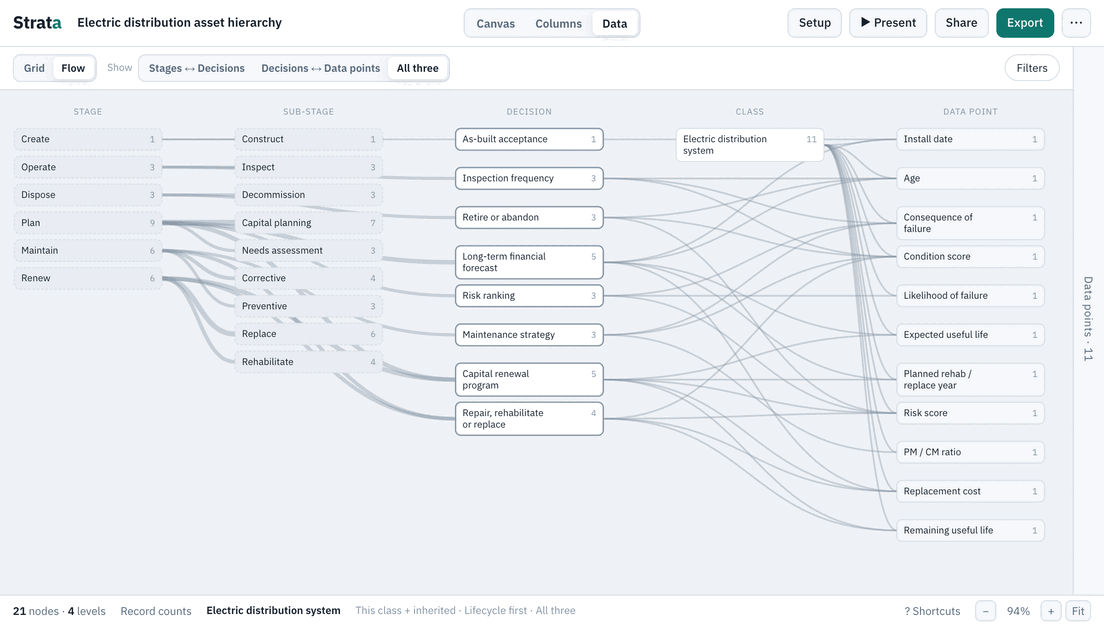
“Is our data good?” sounds like one question with one answer. It is really many, and each draws on different data points. Here are five, mapped through the Electric distribution template.
| The question | The decision behind it | Data points it needs |
|---|---|---|
| Where should we spend capital next year? | Capital renewal program | Expected useful life, Remaining useful life, Risk score, Replacement cost, Planned rehab / replace year, Insulation type, Fault count (5 years), Meter type |
| Which assets should we inspect first? | Inspection frequency | Age, Condition score, Consequence of failure, Dissolved gas analysis |
| What failure data would predictive maintenance need? | Maintenance strategy and Risk ranking | Condition score, Likelihood of failure, Consequence of failure, Risk score, PM / CM ratio, Operation count, Fault count (5 years) |
| What will renewal cost over the next twenty years? | Long-term financial forecast | Install date, Age, Expected useful life, Replacement cost, Planned rehab / replace year |
| Which poles do we replace first? | Pole replacement priority | Pole material, Remaining strength |
The template has no decision called “predictive maintenance”, so the third question is mapped to the two nearest: Maintenance strategy, which weighs condition and failure consequence, and Risk ranking, which brings in Fault count (5 years) and the likelihood of failure. If your organization frames a question differently, add or rename the decision. The method stays the same.
The coverage gaps are the finding
Put the five side by side. They need 26 data points between them, but only 18 different ones, because the questions overlap. Eight data points, Expected useful life, Risk score, Replacement cost, Planned rehab / replace year, Fault count (5 years), Age, Condition score, Consequence of failure, each feed more than one of the questions. Ten serve just one.
That shape tells you how to read what you find in the systems.
- A gap in a widely shared data point is expensive. If Replacement cost is missing or untrusted, the capital question and the forecast question both suffer.
- A gap in a one-off data point is narrow. If Remaining strength is thin, only the pole question is affected, and you can answer the others today.
- A question with no data behind it is a different finding. Sometimes the honest report is that it cannot be answered yet, and here is what would change that.
- Data that no question needs is a finding too. It costs money to collect and feeds nothing.
You reach these conclusions before looking at a single record. The record check in step four then confirms them and sizes them.
Checking what your EAM or CMMS holds
For each data point, give one of four honest answers: captured and trusted, captured but needing cleanup, only partly captured, or not captured. Partly captured is not captured. A condition score for half the pipes ranks half the pipes. Strata keeps these answers in a field called Current state, which starts blank on every data point in a template so that filling it in is the exercise.
Two habits make this check hold up. Seat the person who makes the decision next to the person who knows how the data is entered; each is usually surprised by the other. And ask for evidence, such as a count of populated records by class, instead of an impression. The analytics readiness guide walks through the same check for a single decision, and the guide on taking a hierarchy into your systems covers where each data point should live once you know what is missing.
Start from a template
You do not need to start from a blank page. Strata’s templates already hold the decisions, the data points behind them and the context for each. Edit them to match your questions. Open the electric distribution template, set Current state on the data points for one question, and see what the gaps look like. The other seven are on the templates page. Strata models the standard and does not store your records, so your EAM stays exactly as it is.
Related guides
- What is an asset hierarchy? The pillar: levels, classes and instances, common patterns, and the mistakes to avoid.
- Data readiness for analytics Start from the decision, and find the data you are missing.
- Hierarchy, EAM, CMMS and GIS Taking an agreed hierarchy into the systems, and keeping them aligned.
- Is your asset data ready for AI? Why context, not just columns, decides the quality of an answer.
- Asset data glossary Plain definitions of the terms the templates use.