Utility asset management
Utility asset management is the work of keeping pipes, poles, pumps and wires delivering service at a cost and risk the utility can accept. This guide covers what it involves, how it differs between water, wastewater, electric and gas, and the data it rests on.
Published 2026-10-09 · Theory only: general industry knowledge, no client data.
What utility asset management is
Strip away the jargon and utility asset management is a set of answers to three questions. What do we own and what shape is it in? What do we do to it, and when? What does that cost us in money and in risk, compared with the service we promised? Everything else, from condition surveys to capital plans, exists to answer one of those with evidence.
The word that matters is lifecycle. An asset is planned, built, run, maintained, renewed and eventually retired, and the decisions at each stage trade cost against risk. Replace a pipe too early and you waste money. Replace it too late and you get the break. The international standard for asset management systems, ISO 55000, is built around the same idea, and it is a good place to read the formal version. This guide sticks to the practical one.
“Acceptable” is not something the utility decides alone. Regulators set floors for safety and water quality, customers have views on outages and rates, and the board has a budget. Asset management is the discipline of showing, asset class by asset class, what each level of service costs and what risk is left over. Without that, the conversation is opinion against opinion.
How it differs across water, wastewater, electric and gas
The method is the same everywhere. What changes is the kind of asset, the way it fails and the evidence that predicts it. Here is one class and one decision from each sector, taken from the Strata templates.
| Sector | An example class | A decision | A data point it needs |
|---|---|---|---|
| Water | Water main | Pipe renewal priority | Break count (10 years) (breaks) |
| Wastewater | Gravity sewer | Sewer cleaning schedule | Blockage count (5 years) (events) |
| Electric | Pole | Pole replacement priority | Remaining strength (%) |
| Gas | Plastic main | Leak survey frequency | Leak count (5 years) (leaks) |
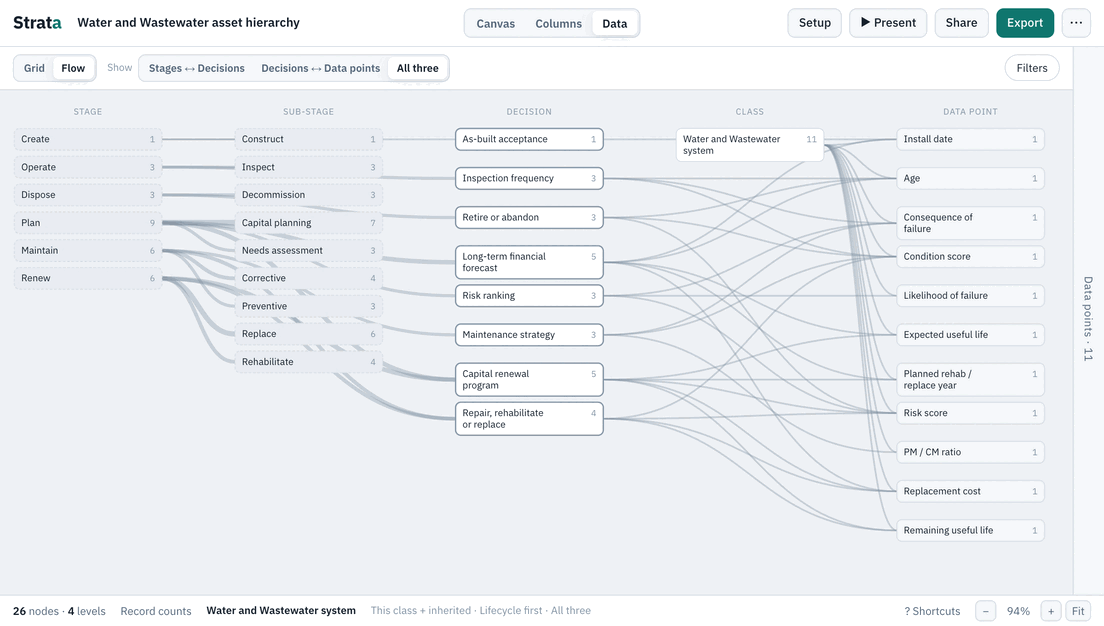
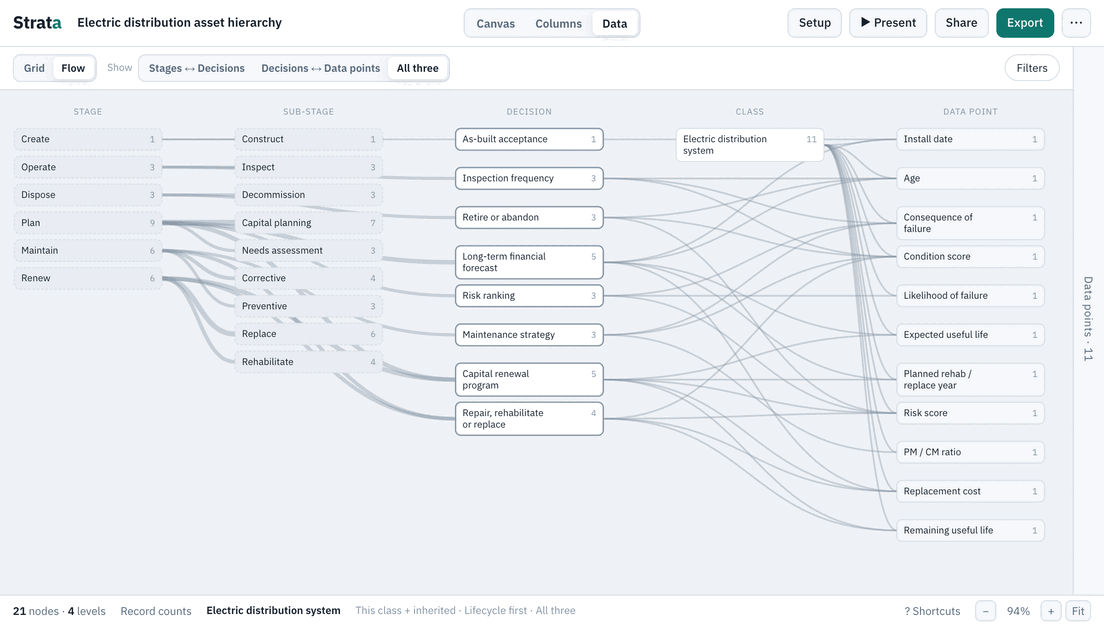
A buried water main fails by breaking, so break history is the best predictor of the next one. A wastewater sewer fails by blocking or collapsing, so the evidence is blockages and camera inspection. A wood pole fails by losing strength you cannot see from the ground, so the data is a measurement. A plastic gas main is judged on leaks found, and the decision is how often to go looking. Four sectors, four failure modes, one method. Lives differ too: a pole may stand for decades, while a pump or a meter is on a much shorter clock, so the same decision, renew or not, gets asked at very different intervals. The Water and Wastewater, Electric distribution and Gas distribution templates hold the full versions.
The data foundation
Asset management programs stall on data more often than on method. Three pieces make up the foundation, and they depend on each other.
- The hierarchy. A tree of classes with a clear level structure, so every asset is one kind of thing with one parent. The guide to the asset hierarchy covers how to build one.
- The data points. What you record about each class, with a unit and a reason. Defined once on a parent class, they pass to everything below.
- The decisions. Each data point should feed at least one decision, and each decision sits in a lifecycle stage. This is the part most registers leave out.
Take the water row above. Break count (10 years) exists because Pipe renewal priority needs it, and that decision happens in Plan › Needs assessment and Renew › Replace. Without the chain, someone eventually asks why the field crew spends time recording it, and nobody can say. With it, the answer is on the page. The readiness guide shows how to test whether the data you hold can support a decision.
Two habits keep the foundation useful. Give every data point an owner, meaning a person who answers when it goes stale. And name each agreed version of the standard, so a report can say which one it was built on. A hierarchy that anyone can edit and nobody owns drifts within a year.
Water utility asset management
Water utilities have an extra reason to get the data right. Most of what they own is buried, so condition is learned slowly and expensively, and the rules they answer to ask for evidence. The guide to Effective Utility Management data pairs the ten attributes of that framework with the decisions and data points in the templates.
Lead service lines show why context matters. In the Water and Wastewater template, the Service line class carries a data point called Lead status, and the template records why: known, suspected or confirmed lead lines must be found and replaced. It is gathered from field inspection and design records / as-built, and it feeds Pipe renewal priority and Design standards. A utility that has the field but not the reason will struggle to explain why half the values are blank. One that has both can see which decision is stuck and who owns the fix.
Where to start
- 01
Pick the closest template
Open the one nearest your system and change what does not fit. It is quicker to edit a worked example than to fill a blank page.
- 02
Name the decisions leadership asks about
Capital spending, inspection order, renewal. Write them as your managers say them, then link each to the data points it needs.
- 03
Check the gaps
For each data point, record whether it is captured and trusted today. The ones that are not, and the ones that feed nothing, are your first list of work.
The Start here page walks through the setup, and the leadership questions guide shows the gap check in full. Do not wait for perfect data before you begin. You only need data good enough for the decision in front of you, and the first pass will show you which of your assumptions were wrong. Strata models the standard. It does not hold your records or replace the systems that run the work.
Related guides
- What is an asset hierarchy? The pillar: levels, classes and instances, common patterns, and the mistakes to avoid.
- Effective utility management data The ten EUM attributes and the asset data behind them.
- Data readiness for analytics Start from the decision, and find the data you are missing.
- Can your EAM data answer leadership? Start from the questions leadership asks and check the data behind each.
- Hierarchy, EAM, CMMS and GIS Taking an agreed hierarchy into the systems, and keeping them aligned.